Reading-Notes-for-Advanced-Software-Development-in-Python-Course
Matplotlib tutorial
What is Matplotlib
To make necessary statistical inferences, it becomes necessary to visualize your data and Matplotlib is one such solution for the Python users. It is a very powerful plotting library useful to worke with Python and NumPy. The most used module of Matplotib is Pyplot which provides an interface like MATLAB but instead, it uses Python and it is open source.
A Matplotlib figure can be categorized into several parts as below:
-
Figure: It is a whole figure which may contain one or more than one axes (plots).
-
Axes: It is what we generally think of as a plot. A Figure can contain many Axes. It contains two or three (in the case of 3D) Axis objects. Each Axes has a title, an x-label and a y-label.
-
Axis: They are the number line like objects and take care of generating the graph limits.
-
Artist: Everything which one can see on the figure is an artist like Text objects, Line2D objects, collection objects. Most Artists are tied to Axes.
Getting Started with Pyplot
Pyplot is a module of Matplotlib which provides simple functions to add plot elements like lines, images, text, etc. to the current axes in the current figure.
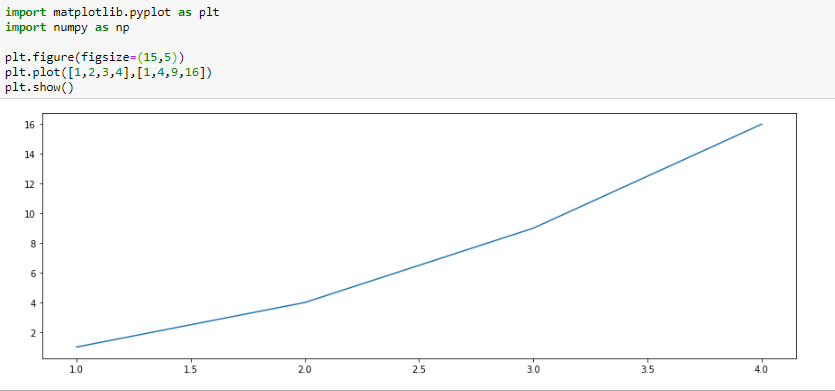
First, import the needed modules:
import matplotlib.pyplot as plt
import numpy as np
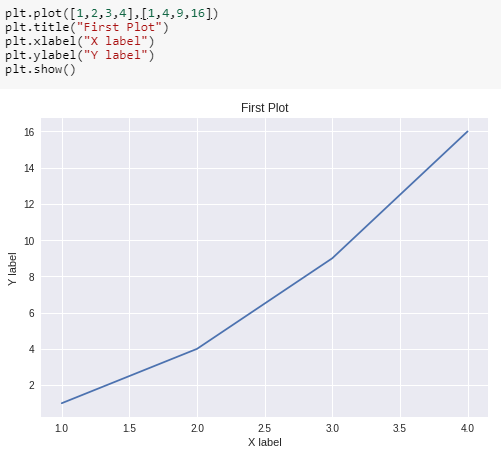
Pass two arrays as input arguments to Pyplot’s plot() method and use show() method to invoke the required plot. The first array appears on the x-axis and second array appears on the y-axis of the plot. Add the title, and name x-axis and y-axis using methods title(), xlabel() and ylabel() respectively.
We can also specify the size of the figure using method figure() and passing the values as a tuple of the length of rows and columns to the argument figsize
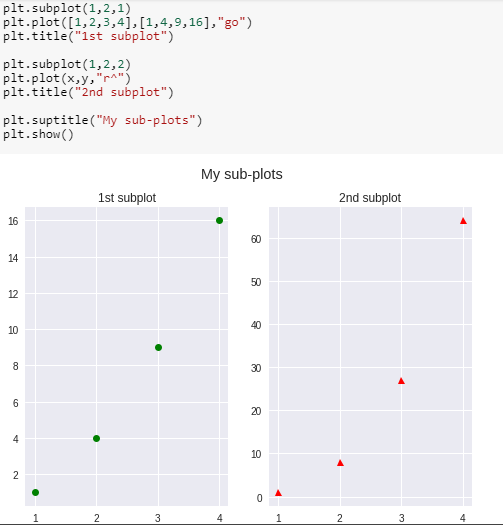
Multiple plots in one figure:
We can use subplot() method to add more than one plots in one figure.
The subplot() method takes three arguments: they are nrows, ncols and index. They indicate the number of rows, number of columns and the index number of the sub-plot.
Note that we have separately used title()method for both the subplots. We use suptitle() method to make a centralized title for the figure.